C.9. Selecting a Measurement Procedure to Obtain Representative Data
In behavior analysis, selecting an appropriate measurement procedure is essential for gathering data that accurately reflects the target behavior and aligns with both the critical dimensions of the behavior and the practical constraints of the environment. The right measurement choice can make the difference between valid, actionable data and data that misrepresents the behavior, potentially leading to ineffective interventions.
Key Considerations for Selecting a Measurement Procedure
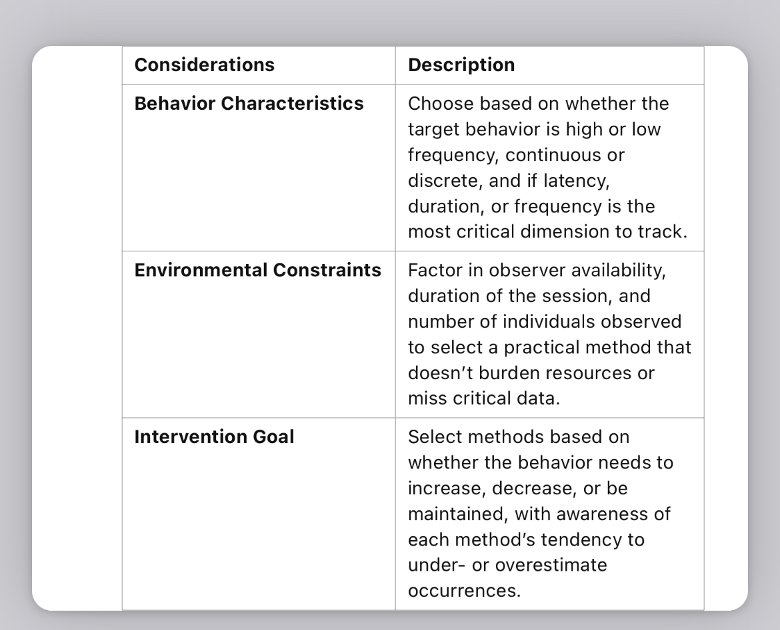
1. Behavioral Dimension
Different behaviors have unique characteristics that should guide measurement selection:
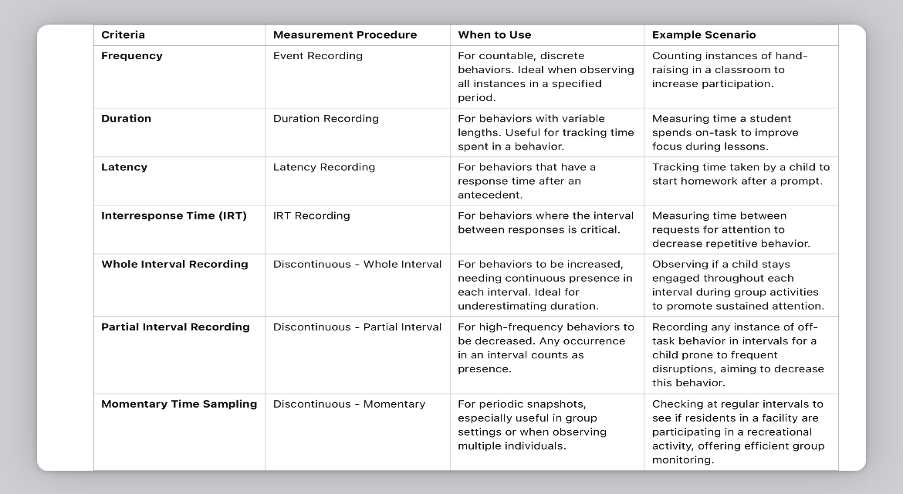
• Frequency: For behaviors that are countable and discrete, such as hand-raising in class.
• Duration: For behaviors that vary in length, such as staying on task or tantrums.
• Latency: For behaviors triggered by an antecedent, where the response time is essential, like the time taken to begin homework after a prompt.
• Interresponse Time (IRT): For behaviors with relevance to the interval between occurrences, such as the time between episodes of asking for attention.
2. Environmental Constraints
Practical considerations impact what measurement method can realistically be used:
• Time Available: In settings where continuous observation is not feasible, a discontinuous measurement method like interval recording might be appropriate.
• Observer Resources: When multiple observers are unavailable, methods such as momentary time sampling can be effective, especially for group settings.
• Behavior Frequency: If a behavior occurs very frequently or rarely, some methods may over- or underestimate its presence, requiring careful selection based on these patterns.
3. Goal of Intervention
The purpose of the data collection should align with the intended outcomes:
• For behaviors to be increased, methods like whole interval recording (capturing continuous behavior) are effective.
• For behaviors to be decreased, partial interval recording may be appropriate, capturing any occurrence within intervals.
• Accuracy and Precision: Some interventions need precise measurements, while others might only require general trends.
Examples of Measurement Procedure Selection in Practice
Scenario 1: Increasing On-Task Behavior
• Behavior Dimension: Duration
• Environmental Constraints: Observers are available only periodically
• Measurement Selection: Whole interval recording allows the BCBA to record if a student was engaged during the entire interval, which aligns with the goal of promoting sustained attention.
Scenario 2: Reducing Physical Aggression
• Behavior Dimension: Frequency and Intensity
• Environmental Constraints: Behavior occurs sporadically throughout the day
• Measurement Selection: Partial interval recording allows any instance of aggression to be recorded within intervals, capturing all occurrences without requiring continuous observation.
Scenario 3: Evaluating Social Interactions in a Group Setting
•Behavior Dimension: Latency (time taken to initiate interaction after a peer prompt)
• Environmental Constraints: Large group, limited observers
• Measurement Selection: Momentary time sampling can capture instances of social interaction across the group, allowing for a snapshot view without needing continuous monitoring of each individual.
Scenario 4: Measuring Compliance with Instructions
• Behavior Dimension: Latency and Frequency
• Environmental Constraints: Limited time for observation in a busy classroom
• Measurement Selection: Event recording during specified instructional periods helps capture the frequency of compliance, while latency can be measured when the behavior occurs right after a directive.
Practical Tips for BCBAs
• Align with Behavior Characteristics: Choose methods based on the nature of the behavior (e.g., latency for prompt-dependent actions).
• Adjust for Environment: Account for observer availability and other constraints to ensure that the chosen method is feasible and produces representative data.
• Monitor Accuracy: Periodically review data for reliability, adjusting procedures if they do not accurately reflect the behavior.
By selecting measurement methods thoughtfully, BCBAs can ensure their data accurately reflects client behaviors, supports valid assessment, and leads to effective, targeted interventions.
C.10. Graph Data to Communicate Relevant Quantitative Relations
Graphing data is essential for behavior analysts to visually represent quantitative relations, enabling clearer analysis, communication, and decision-making about client progress and intervention effectiveness. Selecting the right type of graph depends on the nature of the data, the goals of the intervention, and the information that needs to be communicated to other stakeholders. The following are commonly used graph types in applied behavior analysis:
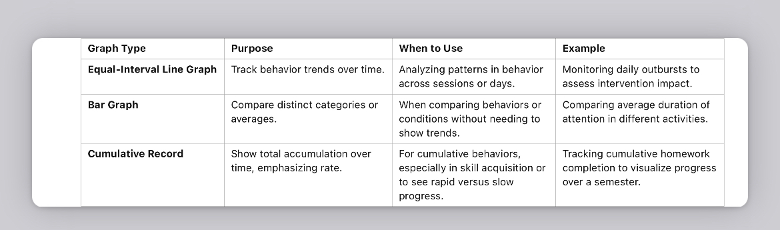
Equal-Interval Line Graphs
Purpose: Line graphs are widely used in behavior analysis because they allow for clear visual representations of behavior trends over time. They show changes in data across equal intervals, making it easy to track patterns in behavior frequency, duration, or other metrics.
When to Use:
• When observing the trend of a behavior across days, weeks, or sessions.
• When you want to analyze the impact of interventions over time.
Example:
A BCBA monitors a student’s outbursts across school days. The frequency of outbursts is plotted on a line graph, with each session on the x-axis and the number of outbursts on the y-axis. This graph helps determine if the intervention is reducing outbursts over time.
Bar Graphs
Purpose: Bar graphs provide a snapshot comparison between different conditions, individuals, or behaviors. They are ideal for showing discrete data points where a simple comparison is more important than tracking a trend over time.
When to Use:
• When comparing distinct categories or groups (e.g., comparing two different interventions).
• When summarizing the data in terms of averages or totals for specific intervals.
Example:
A BCBA compares the average duration of two different activities to see which one maintains a child’s attention longer. Each activity’s average duration is represented by a bar, allowing for an easy comparison.
Cumulative Records
Purpose: Cumulative records show the total accumulation of a behavior over time, with each point representing the sum of all previous responses. This type of graph emphasizes the rate of behavior accumulation and highlights any sudden changes in frequency.
When to Use:
• When the overall rate of response accumulation is of interest.
• When examining behavior trends over an extended period.
• Useful for behaviors that are expected to increase, such as skill acquisition.
Example:
A BCBA tracks the number of completed homework assignments by a student. Each session’s total is added to previous totals, resulting in a cumulative count. Steep inclines on the graph indicate rapid progress, while plateaus indicate periods with no assignments completed.
Key Considerations in Choosing Graph Types
• Behavioral Goals: Choose a graph type that best aligns with the intervention’s purpose. For ongoing tracking and trend analysis, line graphs are often best. For summarizing distinct data points, bar graphs are more suitable.
• Audience and Communication Needs: Consider the audience who will view the graph. For instance, cumulative records may be less intuitive for families or stakeholders unfamiliar with this format, while bar graphs and line graphs are generally easier to interpret.
• Intervention Phase Changes: Equal-interval line graphs can be especially useful for showing changes across different phases (e.g., baseline, intervention, follow-up), as the data points and trends can be segmented and annotated to illustrate the effects of each phase.
Each graph type has unique advantages, making it essential to match the graph type with the data’s purpose and audience. Effective graphing helps BCBAs visually communicate progress, analyze intervention effectiveness, and make data-driven adjustments to support their clients.
Here are examples of different types of graphs commonly used by BCBAs to communicate quantitative data:
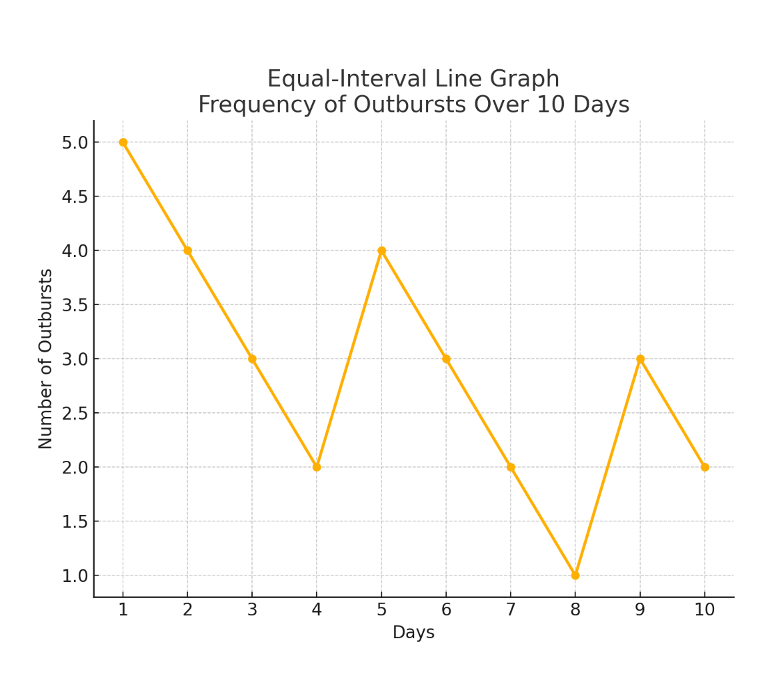
Equal-Interval Line Graph: This graph shows the frequency of outbursts recorded over 10 days, allowing practitioners to observe trends and changes in behavior across days.
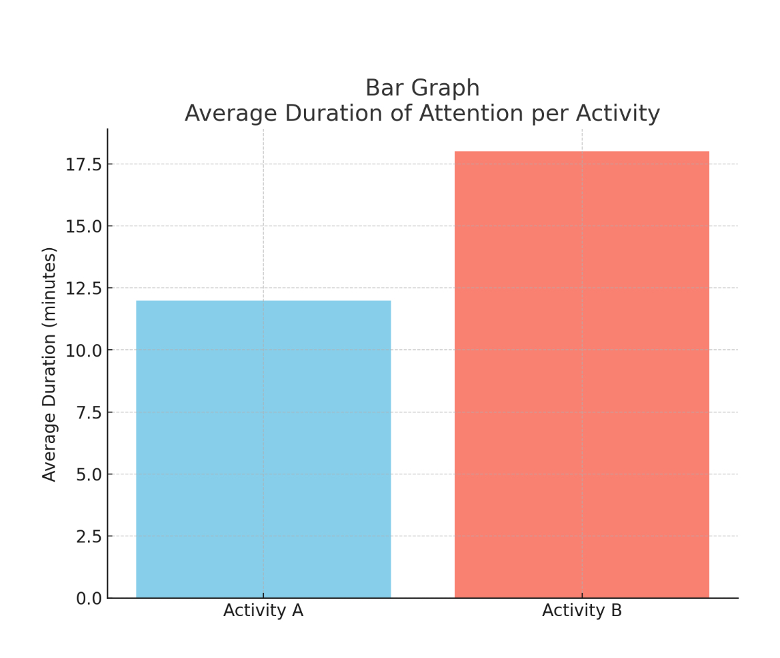
Bar Graph: This graph compares the average duration of attention for two activities, providing a clear visual of differences in engagement across activities.
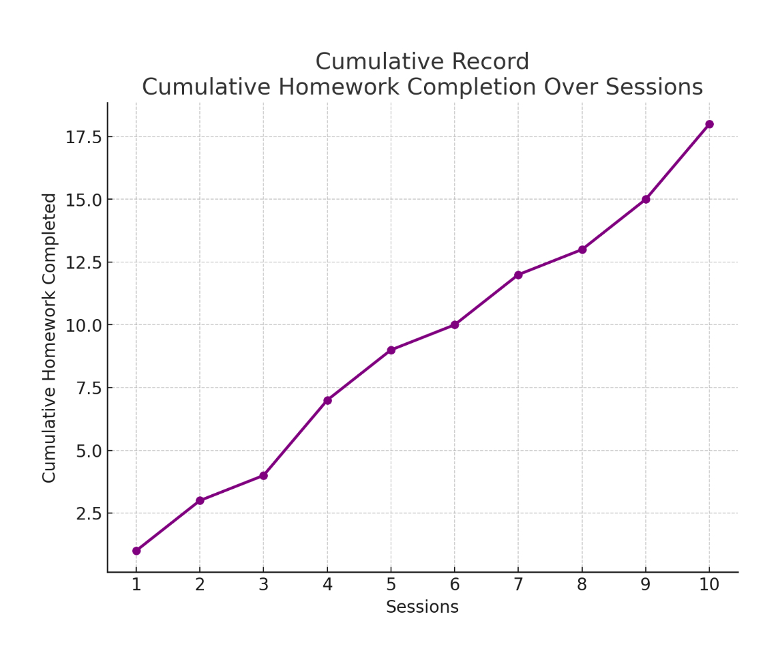
Cumulative Record: This graph tracks cumulative homework completion over sessions, illustrating the progression and overall completion over time.
C.11. Interpret Graphed Data
Interpreting graphed data is a fundamental skill for BCBAs, allowing them to make data-driven decisions about the effectiveness of interventions and any necessary adjustments. Below is an overview of the key aspects to focus on when interpreting graphed data and making informed decisions:
Identify Trends
• What it Means: Trends in data help determine whether the target behavior is increasing, decreasing, or remaining stable over time.
• Example: If a line graph shows a downward trend in aggressive behaviors across sessions, this suggests that the intervention may be effective in reducing these behaviors.
Analyze Levels of Behavior
• What it Means: The level of behavior refers to the average performance of the behavior across data points.
• Example: In a graph tracking compliance during task demands, if the average level remains high across sessions, it might suggest that the client is consistently meeting expectations.
Evaluate Variability
• What it Means: Variability assesses the range or fluctuation in behavior. High variability could indicate inconsistencies in the environment, data collection errors, or other contextual factors affecting behavior.
• Example: If a graph shows high variability in task completion rates, the BCBA might investigate factors such as changes in task difficulty or staff intervention methods.
Examine Data Over Phases
• What it Means: When interventions have multiple phases (e.g., baseline, intervention, follow-up), comparing data across these phases helps in determining the intervention’s impact.
• Example: If a graph shows an increase in positive social interactions during the intervention phase compared to baseline, it indicates the intervention’s positive effect.
Determine Effectiveness
• What it Means: Graphs are essential to assess if an intervention is achieving its desired outcomes. Reviewing all aspects—trend, level, and variability—together provides a comprehensive understanding.
• Example: In a cumulative record tracking skill acquisition, a steady upward trend might indicate successful mastery of the skill.
Look for Anomalies or Outliers
• What it Means: Identifying unexpected data points, or outliers, can reveal unique situations that may require further investigation.
• Example: If one session shows an unusually high instance of tantrum behavior compared to others, it may indicate an environmental trigger or inconsistency in data collection.
Use Visual Aids to Enhance Understanding
• What it Means: Features like trend lines or phase change lines help BCBAs understand the direction of behavior and when interventions were implemented or modified.
• Example: Adding a trend line to a line graph on task completion rates can visually reinforce whether the behavior is moving toward the goal.
Practical Application for BCBAs
• Inform Decision-Making: By interpreting data accurately, BCBAs can adjust interventions in real time to better serve clients.
• Communication with Stakeholders: Graphed data simplifies complex information, allowing BCBAs to effectively share progress with families, caregivers, and other team members.
• Monitor and Maintain Treatment Integrity: Interpreting data regularly ensures that the interventions remain aligned with treatment goals.
In summary, interpreting graphed data enables BCBAs to draw meaningful insights into the effects of their interventions, make data-based decisions, and communicate progress clearly. It’s a vital part of effective, evidence-based practice.
Here are scenarios for BCBAs to practice interpreting graphs, each followed by a suggested interpretation or solution:
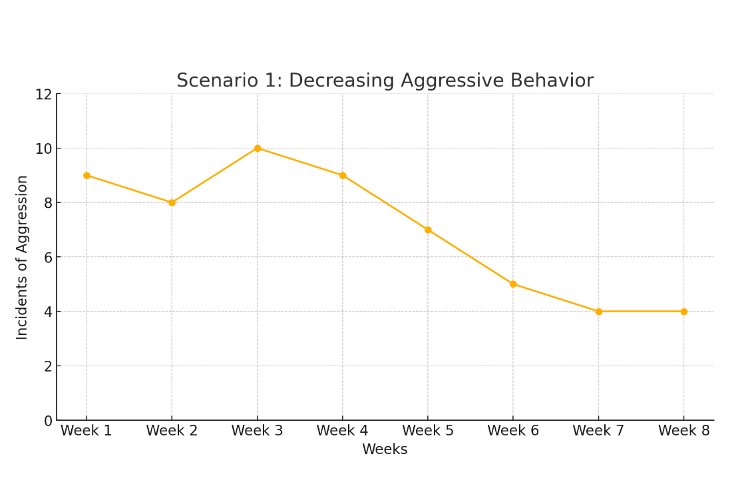
Scenario 1: Decreasing Aggressive Behavior
Context: A BCBA is working with a client named Sarah who exhibits aggressive behaviors during peer interactions. The BCBA introduces an intervention involving positive reinforcement for calm behavior. They track the number of aggressive incidents across a 4-week period, with a baseline phase and an intervention phase.
Graph Description: During the baseline phase, Sarah’s aggressive behaviors range from 8 to 10 incidents per week. In the intervention phase, a downward trend begins, with incidents decreasing to 4 by the end of the period.
Interpretation:
• Trend: The data show a clear downward trend after implementing the intervention, suggesting it is effective in reducing aggressive behaviors.
• Level: The level of aggressive incidents is significantly lower during the intervention phase compared to baseline.
• Solution: Continue with the positive reinforcement strategy, and monitor if behavior continues to decrease or stabilizes at a low level.
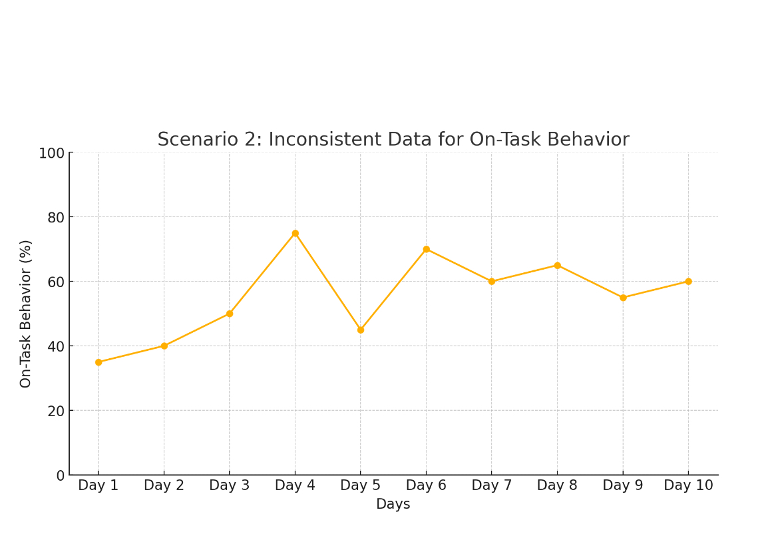
Scenario 2: Inconsistent Data for On-Task Behavior
Context: A BCBA is monitoring on-task behavior in a classroom setting for a student named Jake. They implement a self-monitoring intervention where Jake tracks his own on-task behavior, recorded across a 2-week baseline and a 3-week intervention phase.
Graph Description: During the baseline, on-task behavior ranges from 30% to 40%. In the intervention phase, there is variability: some days on-task behavior reaches 75%, while on other days, it drops to 45%.
Interpretation:
• Variability: High variability in the intervention phase suggests potential inconsistencies. This could be due to differences in classroom activities, Jake’s engagement with self-monitoring, or external distractions.
• Solution: Investigate sources of variability, such as the type of tasks assigned or Jake’s understanding of the self-monitoring process. Additional support, like prompts or teacher reminders, may help stabilize his on-task behavior.
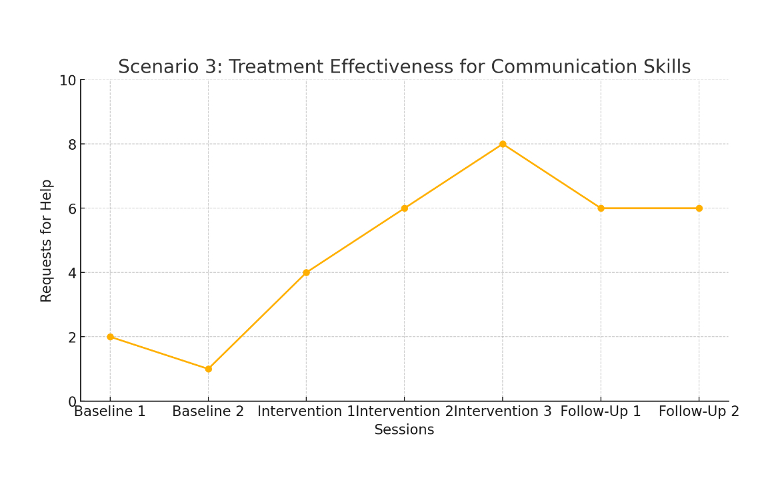
Scenario 3: Evaluating Treatment Effectiveness for Communication Skills
Context: A BCBA implements a communication intervention for a client named Lucas, who struggles to request help appropriately. The goal is to increase his use of the phrase “Can I have help?” They measure occurrences across baseline, intervention, and follow-up phases.
Graph Description: During the baseline, Lucas requests help 1–2 times per session. During the intervention, this number gradually increases to 6–8 times per session. In the follow-up, occurrences remain around 6 per session.
Interpretation:
• Trend and Stability: The intervention shows a positive trend in Lucas’s communication, and follow-up data indicate that improvements are maintained.
• Solution: The intervention appears successful, as Lucas’s skills generalized beyond the intervention. Continue monitoring to ensure long-term maintenance, and consider reinforcing other communication skills if appropriate.
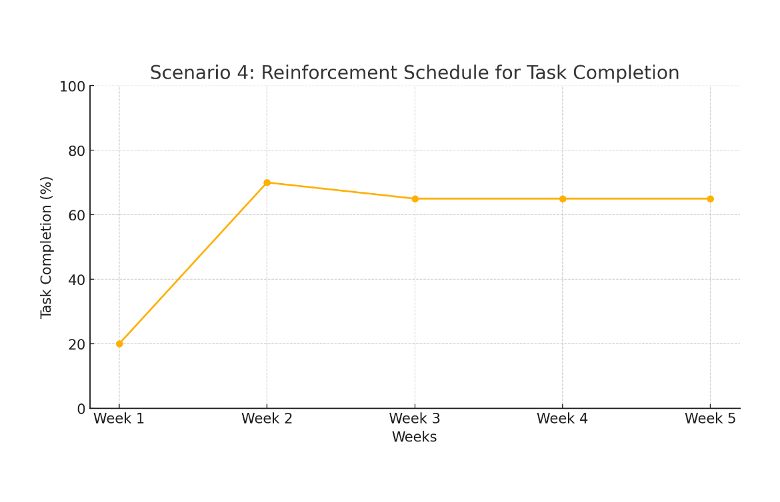
Scenario 4: Assessing Reinforcement Schedule for Task Completion
Context: A BCBA wants to increase task completion for a student, Emma, who often leaves tasks incomplete. The intervention includes a token economy, where Emma earns tokens for completing tasks that can be exchanged for a preferred activity. The data are collected over three weeks.
Graph Description: The line graph shows an initial sharp increase in task completion, from 20% to 70% in the first week, but levels off around 65% in the following weeks.
Interpretation:
• Initial Success with Plateau: The intervention was initially effective, but Emma’s task completion has plateaued.
• Solution: Adjust the token economy to increase motivation, such as adding new reinforcers or providing tokens for completing additional, more challenging tasks.
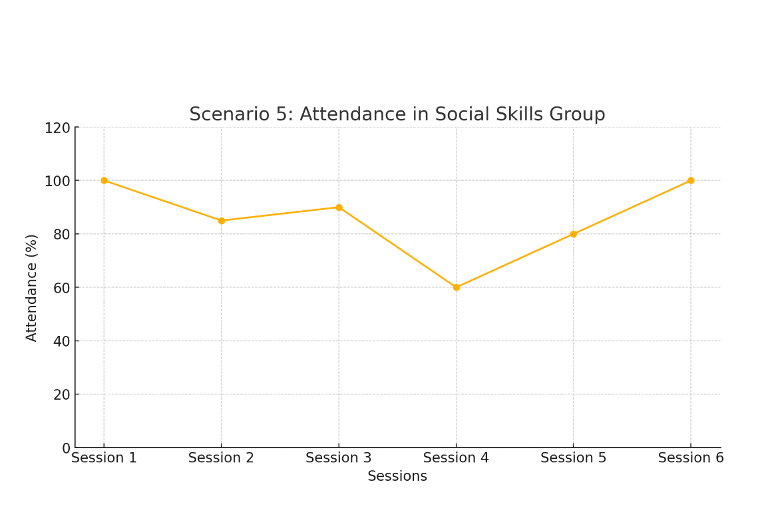
Scenario 5: Identifying Issues with Attendance Using Momentary Time Sampling
Context: A BCBA is tracking group attendance at a social skills group for adolescents. Using momentary time sampling every 10 minutes, they measure how many students are present and participating over a four-week period.
Graph Description: Attendance fluctuates weekly, with some sessions having 100% attendance, but others dropping as low as 60%.
Interpretation:
• Fluctuations: The variation may indicate that external factors (e.g., conflicting activities, lack of interest) are impacting attendance.
• Solution: Consider surveying the students or parents to understand barriers to attendance. Adjust the schedule or format as needed to increase consistent participation.
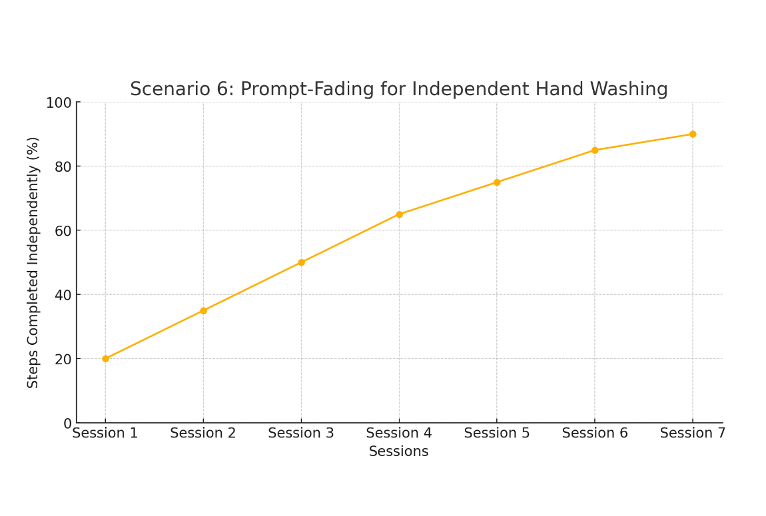
Scenario 6: Effectiveness of Prompt-Fading for Independent Hand Washing
Context: A BCBA is teaching a client, Mia, to wash her hands independently. They use a prompt-fading strategy, gradually removing prompts across sessions. Data points represent the percentage of steps Mia completes independently.
Graph Description: At the start of the intervention, Mia completes 20% of steps independently. As prompts are faded, this percentage gradually rises to 90% by the final sessions.
Interpretation:
• Positive Trend: The data indicate steady improvement as prompts are faded, showing the success of the intervention.
• Solution: Continue fading prompts until Mia reaches 100% independent completion. Implement periodic maintenance checks to ensure she retains the skill over time.
These scenarios provide BCBA practitioners with practice in interpreting graphs to guide effective decision-making and intervention planning. Each solution emphasizes the adjustments or investigations needed to ensure client progress and optimize treatment outcomes.
Here are examples of different types of graphs relevant to BCBA practice, with explanations of how they can be used to represent behavioral data:
1. Line Graph (Equal-Interval Graph)
2. Bar Graph
3. Cumulative Record
4. Scatter Plot
5. Pie Chart
Summary:
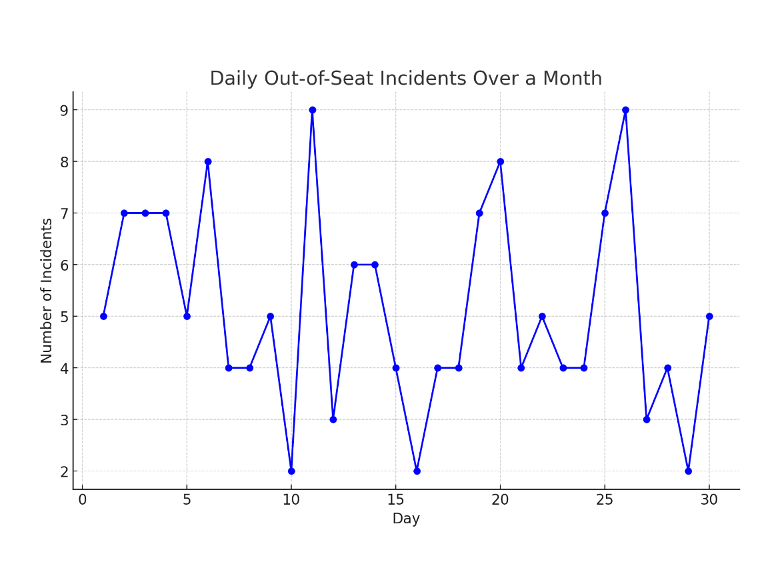
1. Line Graph: Shows daily out-of-seat incidents over a month, useful for tracking frequency trends over time.
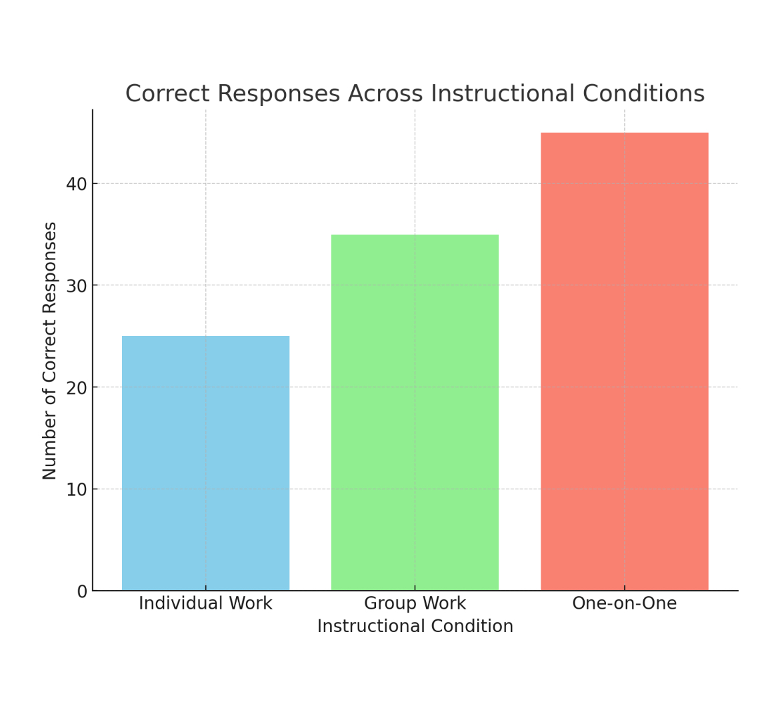
2. Bar Graph: Compares the number of correct responses across various instructional conditions, ideal for contrasting categories.
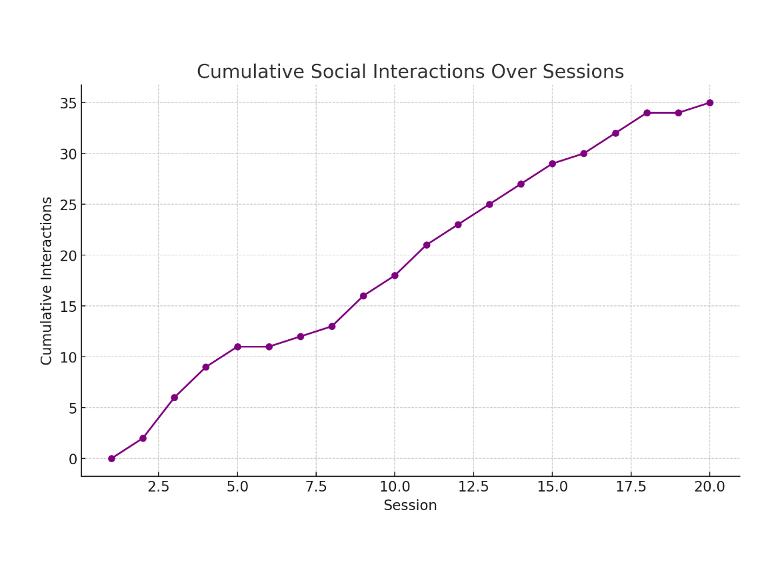
3. Cumulative Record: Displays cumulative social interactions over multiple sessions, effective for tracking behavior accumulation.
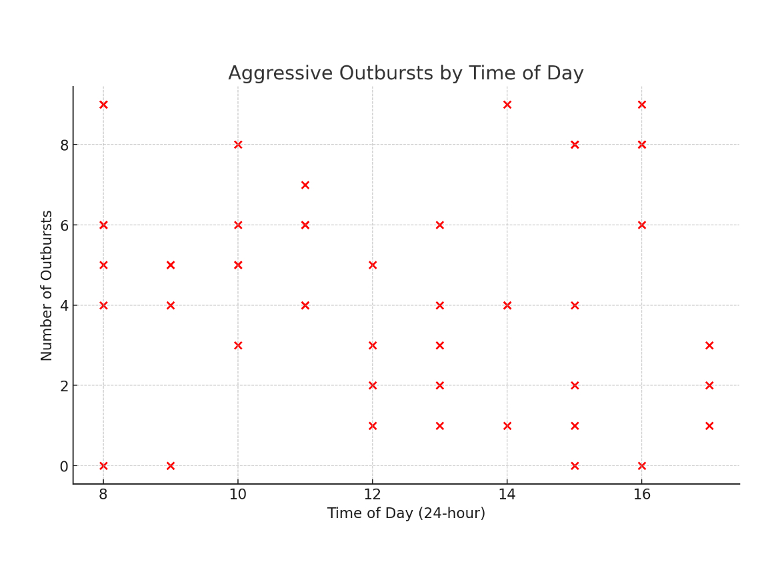
4. Scatter Plot: Plots aggressive outbursts by time of day, helping identify patterns in relation to the time of occurrence.
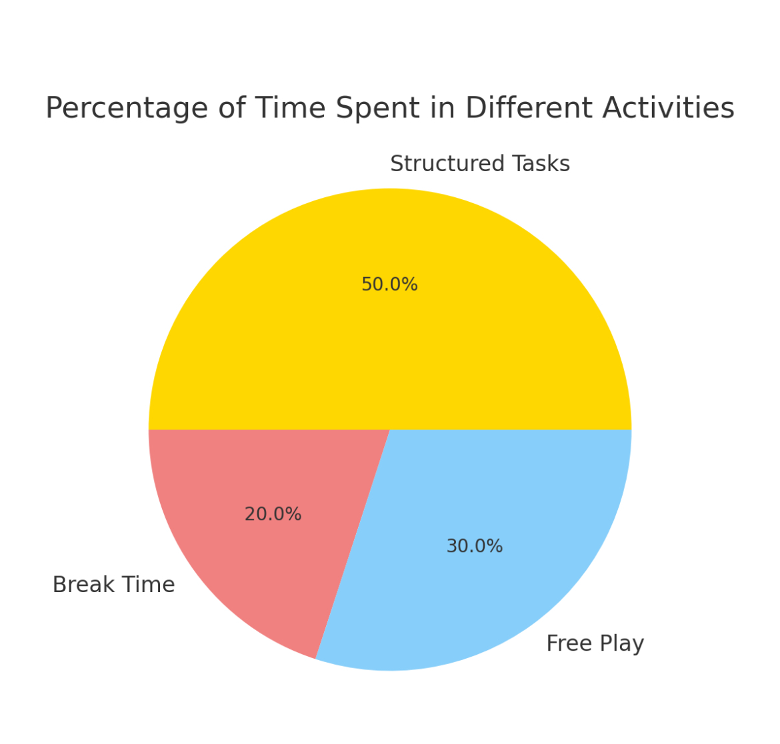
5. Pie Chart: Illustrates the percentage of time spent in different activities, giving a proportional view of time distribution.
These graphs demonstrate various ways to visualize behavior data, aiding in analysis and interpretation for intervention planning.
C.12. Selecting a Measurement Procedure for Representative Procedural Integrity Data
Selecting the right measurement procedure for obtaining representative procedural integrity data is crucial for ensuring that interventions are implemented as intended. Procedural integrity data reflect the fidelity of intervention application, assessing whether procedures were followed accurately and consistently, according to the behavior intervention plan.
Key Dimensions to Consider
1. Accuracy: Measures whether each component of the intervention is delivered exactly as specified. Ensures that each step is implemented as planned.
2. Dosage: Refers to the frequency, duration, or amount of the intervention components delivered. Ensures the client receives the intended “dose” or exposure to the intervention.
3. Consistency: Looks at the regularity of intervention application over time and across sessions or settings.
4. Environmental Constraints: Includes any physical, logistical, or situational limitations that might impact the measurement of procedural integrity (e.g., staffing, session length, resources).
Here are examples illustrating accuracy, dosage, consistency, and environmental constraints that BCBAs might encounter in their daily practice:
1. Accuracy Example: Monitoring Prompting Procedures in Skill Acquisition
• Scenario: A BCBA is working with a child to improve independent dressing skills. The intervention requires the therapist to provide physical prompts only when necessary and fade them gradually as the child gains independence.
• Challenge: Ensuring that each prompt is delivered at the correct time and with the correct level of assistance is crucial for the intervention’s success.
• BCBA Approach: The BCBA uses direct observation with a checklist to track each prompt, ensuring the therapist adheres to the specified prompt level and timing.
• Importance of Accuracy: Accurate implementation is necessary to avoid over-prompting, which could hinder the child’s progress toward independence.
2. Dosage Example: Implementing Reinforcement Schedules in Classroom Behavior Management
• Scenario: A BCBA designs a reinforcement plan for a student to increase on-task behavior. The plan specifies that the teacher should provide reinforcement (e.g., praise or a token) every 5 minutes of on-task behavior.
• Challenge: Due to the busy classroom setting, the teacher occasionally misses reinforcement opportunities, resulting in an inconsistent “dose” of reinforcement.
• BCBA Approach: The BCBA introduces a timer to remind the teacher when to deliver reinforcement, helping maintain the correct dosage throughout the day.
• Importance of Dosage: Maintaining the specified reinforcement frequency (or dosage) is essential for the behavior change plan to be effective and to keep the student motivated.
3. Consistency Example: Tracking a Daily Social Skills Program
• Scenario: A BCBA is overseeing a social skills group for teenagers where each session includes role-playing, feedback, and practice. To reinforce social skills, the therapist should provide specific praise after each role-play attempt.
• Challenge: Some therapists may skip or vary the praise based on their individual styles, leading to inconsistent implementation across sessions.
• BCBA Approach: The BCBA establishes a structured protocol and observes sessions to ensure that therapists are delivering praise consistently after each role-play, providing feedback as needed.
• Importance of Consistency: Consistent reinforcement is critical to ensure that all group members receive the same intervention benefits, creating a stable learning environment.
4. Environmental Constraints Example: Conducting Behavior Observations in a Crowded School Cafeteria
• Scenario: A BCBA is tasked with observing and reducing aggressive behavior in a student during lunchtime in a busy school cafeteria.
• Challenge: The noisy and chaotic environment makes it difficult to track every instance of behavior accurately. The BCBA also has limited time and cannot observe daily.
• BCBA Approach: The BCBA opts for momentary time sampling, checking at intervals rather than continuous observation, which allows data collection without needing to track each behavior in real-time.
• Impact of Environmental Constraints: In high-distraction settings, alternative measurement methods help manage limitations, though they may slightly affect data precision.
Summary
• Accuracy: Ensures procedures are applied exactly as planned (e.g., correct level and timing of prompts in skill acquisition).
• Dosage: Maintains a consistent level of intervention (e.g., reinforcement frequency in behavior management).
• Consistency: Ensures the procedure is implemented the same way by all team members (e.g., therapists consistently providing praise in social skills training).
• Environmental Constraints: Recognizes and adapts to external factors that may impact data collection (e.g., time sampling in a noisy cafeteria).
These examples highlight common challenges and solutions that BCBAs employ to maintain procedural integrity in various real-world contexts.
Choosing the Right Measurement Procedure
1. Direct Observation and Checklists
• Description: Direct observation with a checklist involves observing a session and using a step-by-step list of intervention components to mark each as correctly or incorrectly implemented.
• Best Used For: High-accuracy needs, such as verifying that each part of a behavior plan is followed as specified.
• Example: Observing a therapist implementing a social skills program to ensure each planned prompt is delivered correctly.
2. Permanent Product Recording
• Description: Reviews physical or recorded artifacts produced during intervention (e.g., completed worksheets, video recordings) to measure integrity.
• Best Used For: Situations where direct observation is challenging but procedural adherence can be verified by reviewing products from the session.
• Example: Checking the number of completed worksheets for academic interventions or reviewing video footage to verify use of specific prompting techniques.
3. Self-Report and Fidelity Checklists
• Description: Involves the practitioner completing a checklist or rating form about their adherence to the intervention steps.
• Best Used For: Low-resource environments or where direct observation isn’t feasible; self-reports should be verified occasionally with direct observations.
• Example: A therapist completing a self-checklist after each session, marking each step they followed during discrete trial training (DTT).
4. Interval Recording
• Description: Observer records if the procedure was followed correctly during specific intervals, rather than across the entire session.
• Best Used For: Ensuring procedural integrity in long sessions without requiring continuous observation.
• Example: Recording every 5 minutes whether the practitioner used praise as specified in a positive reinforcement program.
5. Time Sampling
• Description: Observer checks for fidelity at randomly selected points in time during a session, useful for periodic assessment.
• Best Used For: Environments with high constraints where continuous or frequent observation is difficult.
• Example: During a classroom observation, recording fidelity for behavior intervention steps at random times throughout the day.
Considerations for Practitioners
• Critical Dimensions: Select a procedure that allows measurement of the most relevant dimensions of integrity (e.g., dosage for interventions requiring consistent reinforcement).
• Practical Constraints: Factor in environmental or logistical limitations, such as staffing or session length, which may affect the feasibility of continuous measurement.
• Data Usefulness: Consider how the integrity data will be used to ensure the chosen measurement procedure accurately reflects practitioner fidelity and supports decision-making for intervention adjustments.
Summary
For BCBAs, choosing a measurement procedure for procedural integrity data requires balancing accuracy, practicality, and relevance. By selecting the right method, BCBAs can maintain the quality and consistency of interventions, ensuring they are implemented as designed and yielding the best possible outcomes for clients.
Here are several real-world scenarios illustrating how a BCBA might apply measurement procedures to gather representative procedural integrity data, factoring in accuracy, dosage, consistency, and environmental constraints:
Scenario 1: Direct Observation with Checklist for a Social Skills Program
• Setting: A BCBA is overseeing a social skills group for children with autism, where specific prompting and reinforcement strategies must be implemented consistently by the therapist.
• Procedure: The BCBA uses a checklist during sessions to observe and record if each step of the protocol (e.g., modeling, prompting, reinforcement) is correctly applied in every interaction.
• Key Integrity Dimension: Accuracy—The checklist ensures each specific component is implemented exactly as intended.
• Environmental Constraint: Sessions are limited to 30 minutes, so the BCBA focuses on capturing key intervention points using the checklist for precise observation within this time frame.
Scenario 2: Permanent Product Recording in an Academic Intervention
• Setting: A BCBA is monitoring a daily academic intervention in a school, where teachers are tasked with implementing structured activities to improve on-task behavior.
• Procedure: The BCBA uses permanent product recording by reviewing completed worksheets from each session. They assess the number of correctly completed tasks to confirm if the intervention steps were followed.
• Key Integrity Dimension: Dosage—This ensures students are completing the intended “dose” of academic tasks as part of the intervention.
• Environmental Constraint: Direct observation is not feasible during each session due to limited BCBA availability, so permanent product recording provides a practical alternative to assess integrity.
Scenario 3: Self-Report Checklist in Discrete Trial Training (DTT)
• Setting: A therapist provides discrete trial training (DTT) to a child in a clinic setting. Due to staffing limitations, the BCBA cannot observe every session.
• Procedure: After each session, the therapist completes a self-report checklist, marking each DTT component they implemented (e.g., reinforcement delivery, prompt fading, error correction).
• Key Integrity Dimension: Consistency—The self-report enables ongoing, consistent tracking of procedural adherence without requiring a BCBA to be present each time.
• Environmental Constraint: Limited BCBA availability for real-time observation; occasional spot checks by the BCBA validate the self-report data.
Scenario 4: Interval Recording for a Classroom Behavior Intervention
• Setting: A BCBA implements an intervention in a classroom to reduce disruptive behavior. The teacher is supposed to provide praise every 5 minutes if the student remains on task.
• Procedure: The BCBA uses interval recording by observing the session in 5-minute intervals and recording if the teacher delivers praise as specified.
• Key Integrity Dimension: Accuracy and Dosage—Interval recording ensures the teacher provides praise at the specified frequency, which is critical for the intervention’s effectiveness.
• Environmental Constraint: The teacher has a busy classroom with other students, so interval recording allows for fidelity checks without requiring continuous observation.
Scenario 5: Time Sampling for a Residential Facility Behavior Plan
• Setting: In a residential facility, a BCBA designs a behavior plan for a resident with challenging behaviors. Staff are expected to apply certain strategies at specific times during daily routines.
• Procedure: The BCBA employs momentary time sampling by randomly checking in during the day and observing if the strategies (e.g., prompts, praise, redirection) are used correctly at those moments.
• Key Integrity Dimension: Accuracy—This method provides a snapshot to assess whether procedures are being followed without requiring full-day observations.
• Environmental Constraint: Due to staffing and facility demands, continuous observation isn’t feasible, making random time sampling a practical approach for assessing fidelity.
Scenario 6: Combining Methods in a Functional Communication Training (FCT) Intervention
• Setting: A BCBA oversees a functional communication training (FCT) intervention for a nonverbal child in a school, where teachers are trained to use a communication board.
• Procedure: During structured teaching sessions, the BCBA uses partial interval recording to ensure the communication board is presented every interval. During unstructured play, momentary time sampling is used to record if teachers respond appropriately when the child uses the board.
• Key Integrity Dimension: Accuracy and Consistency—Partial interval recording checks the teacher’s use of the communication board, while time sampling captures fidelity in unstructured times.
• Environmental Constraint: Different school environments and varying staff availability make a flexible, combined approach essential for accurate monitoring.
Scenario 7: Direct Observation of Dosage in an Exposure Therapy Program
• Setting: A BCBA implements exposure therapy for a client with social anxiety, where the intervention requires gradual exposure to social situations over timed intervals.
• Procedure: The BCBA observes sessions with a stopwatch to record the total time the client spends in each social situation, ensuring the correct “dose” of exposure is provided in each session.
• Key Integrity Dimension: Dosage—The focus on timing ensures the client is receiving the intended exposure duration critical for therapeutic effect.
• Environmental Constraint: The exposure sessions are time-limited and structured, requiring precise adherence to planned timing for effective outcomes.
Summary
These scenarios illustrate how BCBAs select and apply measurement procedures for procedural integrity based on intervention goals and constraints. By aligning methods with the critical dimensions of accuracy, dosage, consistency, and practical limitations, BCBAs can gather reliable data to monitor and enhance intervention fidelity effectively.